1. Our team will reach out in <30 minutes.
Check your inbox or phone, we’ll tailor your demo to your use case.
2. We build your custom demo
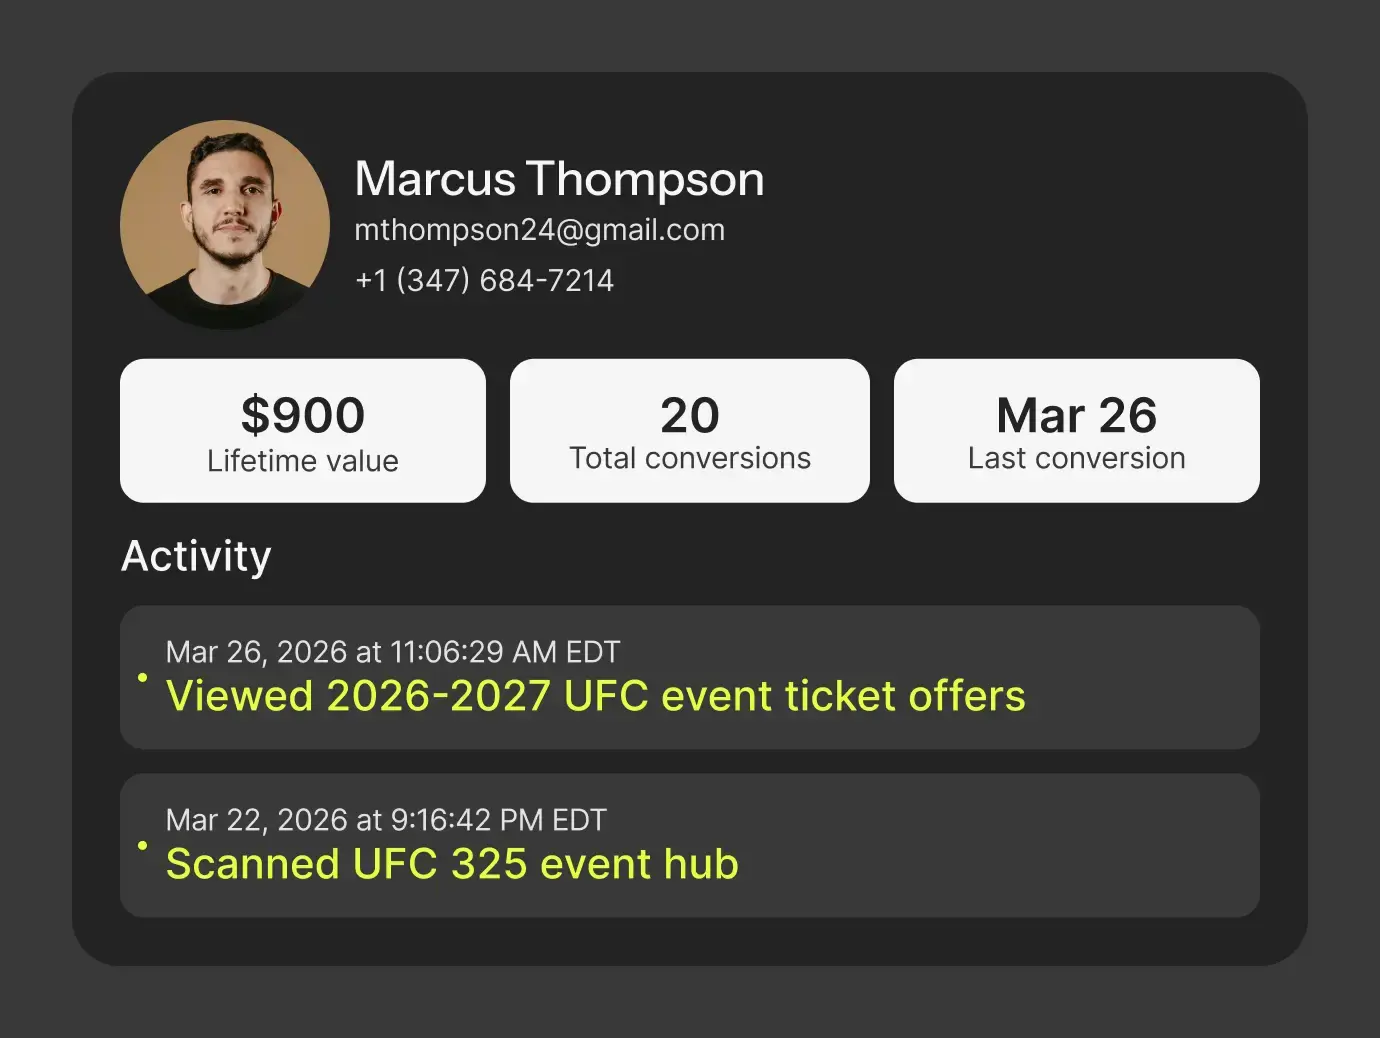
Flowcodes, FlowURLs, and FlowHubs with the data behind the whole platform - so you see exactly what Flowcode unlocks.
3. You go live in days
Our team handles setup. You handle growth.


.png)
.png)
.png)
.png)
.png)

.png)
.png)

.png)

%20copy%203.png)


Back to all articles
Case Study: Big Ten's Strategy To Unify Fan Data At Scale
March 17, 2023

As one of the most premier collegiate conferences in the US, the Big Ten is constantly testing and implementing leading technology solutions to provide the best experience for students, athletes, and fans. One of their many wins this past season was implementing Flowcode’s API into their data management systems.
The Problem
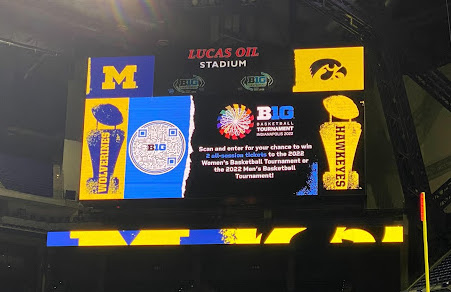
The Big Ten Conference runs and manages activations across their university properties; and with hundreds of sporting and ancillary events throughout the year it was a struggle to directly attribute the first party data that was captured. With multiple inputs, activations and data sources, the Big Ten needed to build a consolidated and cohesive database to understand their community and measure the success of their campaigns throughout the year - across all 14 schools.
The Solution
The Big Ten was able to connect their internal database with Flowcodes connector, CRM endpoint, and Flowpage endpoints in under 50 hours of engineering time. This allowed them to spin up a recurring job that hit the Flowcode analytics API every 6 to 8 hours to continuously update their tracking dashboard. This provided them with real-time insights to optimize their sweepstakes campaign, on-site activations and in stadium placements. All of the first-party data collected from 14 different schools landed directly into their data warehouse - providing insights for future campaign strategies.
A majority of the data that was collected was from pre and post event activations & operations - capturing a collective picture of the activation in its entirety. Expanding the learnings from just in-stadium activities to the entire gameday experience.
How the Data Flows
The Big Ten calls the analytics endpoints with AWS Lambda. They then consume the events through Fivetran that get staged into s3 cloud storage. Finally Snowflake pulls the data from the s3 bucket.
Conclusion