Lorem ipsum dolor sit amet consectetur. Non mauris at at ullamcorper enim mauris massa. Et id arcu placerat facilisis. Aliquam in eget velit faucibus nunc cras aliquam. Tellus nunc viverra imperdiet convallis laoreet lacus placerat mauris et.Cras massa rutrum bibendum pellentesque platea id.
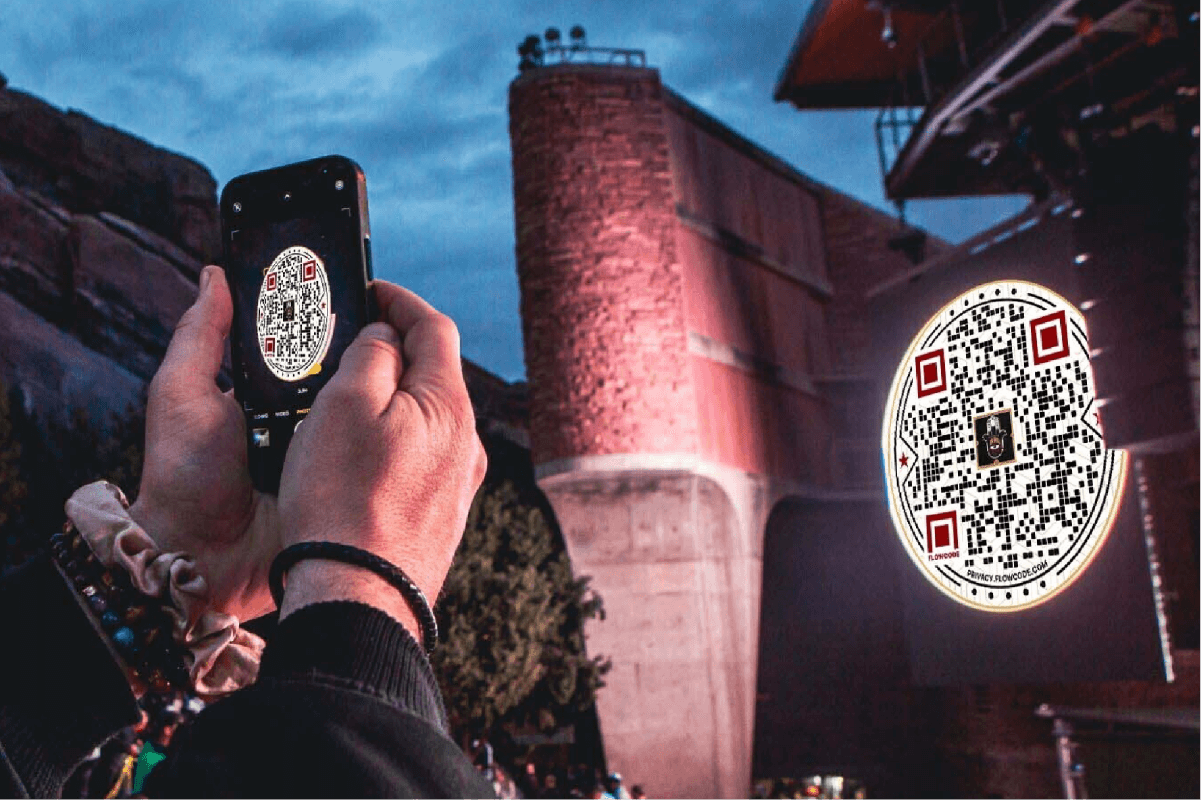
One of the main drawbacks of classic QR codes was that you could not track how many people scanned them. So, no matter how many flyers you distributed with your code, you would have no idea how effective your QR campaign was. This was one of the reasons why QR codes fell out of favor in the U.S.
With Flowcode and our analytics dashboard, you can monitor how many people scan each code, as well as when they do it and with what device. This is extremely valuable data that you can use to improve your marketing. And with Flowcode Pro you get even more advanced analytics and data insights. Read on to learn about the key metrics for Flowcode and how to analyze your results.
Every Flowcode you create generates data that you can track in your Flowcode dashboard. Understanding these metrics allows you to analyze the results. After all, what’s the point of a Flowcode if no one scans it? Knowing how, when, and where your codes attract potential customers is crucial to an effective Flowcode marketing strategy.
Number of Scans
The core metric for any Flowcode is, of course, how many times it was scanned. You can break this down into overall scans and unique scans. A unique scan only counts a user once. So, if someone scans your Flowcode twice, your overall scans will go up by 2 but your unique scans will only increase by 1.
Users are determined by the device they use to scan, but as most consumers scan a Flowcode with smartphones and only use one smartphone, a code’s number of unique scans is a good indication of how many people your Flowcode campaign has reached.
Scans Per Day
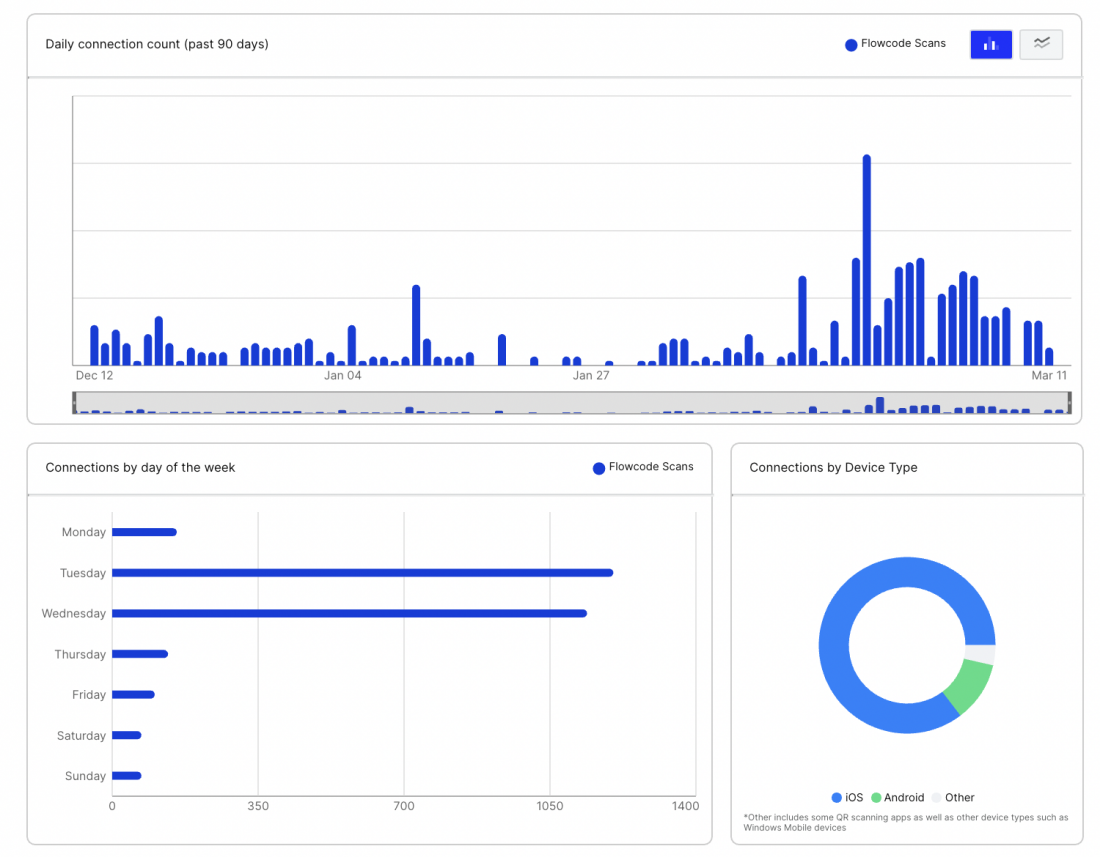
Of course, the total number of scans is only part of the picture. How many scans are you getting per day? Flowcode gives you a snapshot of each code’s average scans per day, as well as the total number of scans over the past 2 days.
Whether you’re running a time-sensitive campaign or want to track overall progress, pay attention to these metrics.
If you upgrade to Flowcode Pro, you’ll gain even more insights into how your codes are performing. You can see overall trends, including how much your daily scans increased or decreased per day.
User Insights
Your dashboard will also show you the top geographic locations and devices for your code’s scans. This is helpful as you’re prioritizing where to target your audience and optimize for certain devices.
A/B Testing Your Flowcode
If you’ve been using A/B testing in other types of digital marketing, you may be wondering if you can do it with Flowcode as well. The answer is yes. It’s best done with the Duplicate feature, which allows you to copy a Flowcode so that you can have the same code and same destination, yet track them separately. This is helpful when you’re driving traffic from two different versions of a flyer or want to compare scans from your storefront versus scans from your business card. We recommend creating a Flowcode for each destination, then duplicating it for each medium on which you want to print it.
How To Set KPIs and Analyze Flowcode Performance
As with any sort of marketing, you cannot truly measure success until you set your benchmarks. Decide what you want out of your Flowcode campaigns and how they will fit into your overall marketing funnels. From there, you can establish your Key Performance Indicators (KPIs) and track your progress.
Common KPIs include:
Number of Scans
As with any sort of funnel, only a fraction of people who scan your code will end up converting. Naturally, you want as many scans as possible, but you should determine the number of conversions you want from a Flowcode campaign, then work backward to determine how many scans you need. As a general rule, a good conversion rate is between 2 and 10 percent, depending on your industry.
So if you’d like to convert 100 customers from a campaign, you’ll need anywhere from 1,000 to 5,000 scans. And remember, the act of scanning is also a conversion.
Of course, these numbers are just hypothetical. You can improve your scan rate with a combination of a strong incentive and a compelling call-to-action. The environment in which a user encounters your code matters, too… codes on packaging and storefronts are easier to scan than those on billboards. And you can improve your landing page’s conversion rate by optimizing that page with a tool such as Flowpage.
Cost Per Scan
What you really want, though, is for people to scan, and you need a way to measure the impact of those scans. All marketing has a cost you must consider to boost your profitability. So, how much are you effectively paying for each person to scan your code? This is your cost-per-scan, and it will tell you if it’s worth printing a Flowcode on certain media or if you should shift to another approach (e.g. flyers versus direct mailers).
To determine your cost-per-scan, simply divide the total cost of the campaign (including all printing, distribution, etc.) with the total number of scans. For example, if your campaign cost $500 and 2,000 people scanned your Flowcode, your cost-per-scan is $.025 — not bad!
Tips for Reducing Your Cost
Print advertising can be expensive compared to digital marketing efforts. There will always be a materials cost for printing a Flowcode. However, you can still get a good ROI out of a Flowcode marketing campaign. To reduce your cost, follow these tips:
Analyze your Flowcode’s performance to see which medium performs best. If you’ve been printing up hundreds of flyers but don’t see a lot of scans from them, that may not be the best way to distribute your Flowcode.
Create a Flowcode with variable destinations.That’s the beauty of dynamic QR codes: you can update their destination at any time. So rather than constantly printing new codes, focus on codes that can be reused. For example, a Flowcode printed on your marquee that updates weekly with the latest offer is much more cost-efficient than constantly having to generate and print new codes.
Clickthrough Rate
Scans are important, but ultimately they’re meant to lead to a destination, whether that’s visiting a webpage, sending you a text message, etc. You need to track how many people did what you wanted them to do after they scanned your code. This is comparable to email marketing, in which each campaign has a call-to-action leading to a product page, booking form, etc. The number of people who took that call-to-action divided by the number of people who received the campaign is your clickthrough rate.
One key difference between email marketing and QR code marketing is that in the latter, the top of your funnel is often the code. That is, it’s your audience’s point of entry into the buying journey, while email campaigns usually go out to people who have opted in and are therefore already in the funnel. So, what is the ultimate CTA to which your Flowcode drives your audience?
Your clickthrough rate (CTR) measures the number of people who got into your funnel through a Flowcode. Many codes lead to a landing page (e.g. your Flowpage) where there is at least one CTA. To calculate your CTR, compare the number of scans with the number of conversions (i.e. how many people clicked on a link on that landing page). For example, if 200 people scanned your Flowcode to your Flowpage but only 5 people clicked on a link, your CTR is 2.5%.
How To Get More Scans of Your Flowcode
Obviously, the best way to reduce your cost per scan and drive more conversions is to encourage more people to scan your Flowcode. At the end of the day, it’s a numbers game: you’ll never achieve a 100% CTR, but you can get more results with the more people who scan the code. Here’s how:
Make it easy to scan the Flowcode. Always maintain white space around the code and print it at a sufficient size for the distance at which most people will be scanning.
Clearly identify where the Flowcode leads. Just as you have a call-to-action on your landing page, your flyer/direct mailer/business card/etc. should include a bit of text explaining the Flowcode. It can be short, e.g. “Check out my portfolio” or “Book a consultation.”
Express a benefit for scanning the code. While Flowcode is easy and fast to scan, you still need to provide an incentive. Will people have access to a special offer when they scan? Will it be easier to register for something? For inspiration, check out Apple’s use of codes promising faster service at the Genius Bar.
Return on Investment
ROI is probably the easiest metric to calculate. Simply divide the amount generated by a campaign with the amount it cost to print the Flowcode on all materials. If you followed our recommendation and generated duplicate codes for various media, you can compare the number of conversions for each code with the cost of each medium. For example, your ROI for your direct mailers may be higher than the ROI for your flyers.
A marketing campaign is most successful when you track and measure your results. Thankfully, Flowcode makes it easy to do so. Just be sure to label your codes appropriately, then keep a close eye on your results. With a little fine-tuning, you can start driving more conversions and sales. To get started head to Flowcode.com, or upgrade to Flowcode Pro today for even more analytics and data here.
Create a free QR code
Ready to generate a QR code in less than 60 seconds?
Implementing QR Codes in Low-Connectivity Environments
Flowcode's advanced geolocation data map enables users to identify the exact location consumers are scanning QR codes. Customers can access precise demographic data...
QR code scams are skyrocketing — discover how Flowcode is keeping brands safe
Flowcode's advanced geolocation data map enables users to identify the exact location consumers are scanning QR codes. Customers can access precise demographic data...
From pandemic essentials to the new normal: How QR codes rose to prominence
Flowcode's advanced geolocation data map enables users to identify the exact location consumers are scanning QR codes. Customers can access precise demographic data...


.webp)