1. Our team will reach out in <30 minutes.
Check your inbox or phone, we’ll tailor your demo to your use case.
2. We build your custom demo
Flowcodes, FlowURLs, and FlowHubs with the data behind the whole platform - so you see exactly what Flowcode unlocks.
3. You go live in days
Our team handles setup. You handle growth.


.png)
.png)
.png)
.png)
.png)
.png)
.png)
.png)
%20copy%203.png)

Back to all articles
Flowcode Onboarding: Leveraging your Data & Analytics
September 15, 2022

So far in our Flowcode Onboarding series, you’ve learned how to set up your Flowcode account, how to create, manage, and print your Flowcodes, and what Flowpage and Flowtag are. All of these steps are crucial to ensure your codes are set up correctly and have successful engagement!
How might you track that engagement, you ask? Welcome to the data and analytics overview, where we’ll discuss why data is important, how it can be utilized to curate the perfect online ecosystem for your business, and what makes Flowcode’s data superior to other QR-providers’.
Analytics overview
Within Flowcode, there are two main analytics dashboards: Flowcode and Flowpage. Both of these dashboards have relatively similar metrics, but highlight the data respective to each specific product. We’ll walk you through what’s included in each one and how analytics differs between plans. Here's a quick walkthrough of the full platform:
Now, let's dive deeper into your analytics by product type:
Flowcode QR Code Analytics
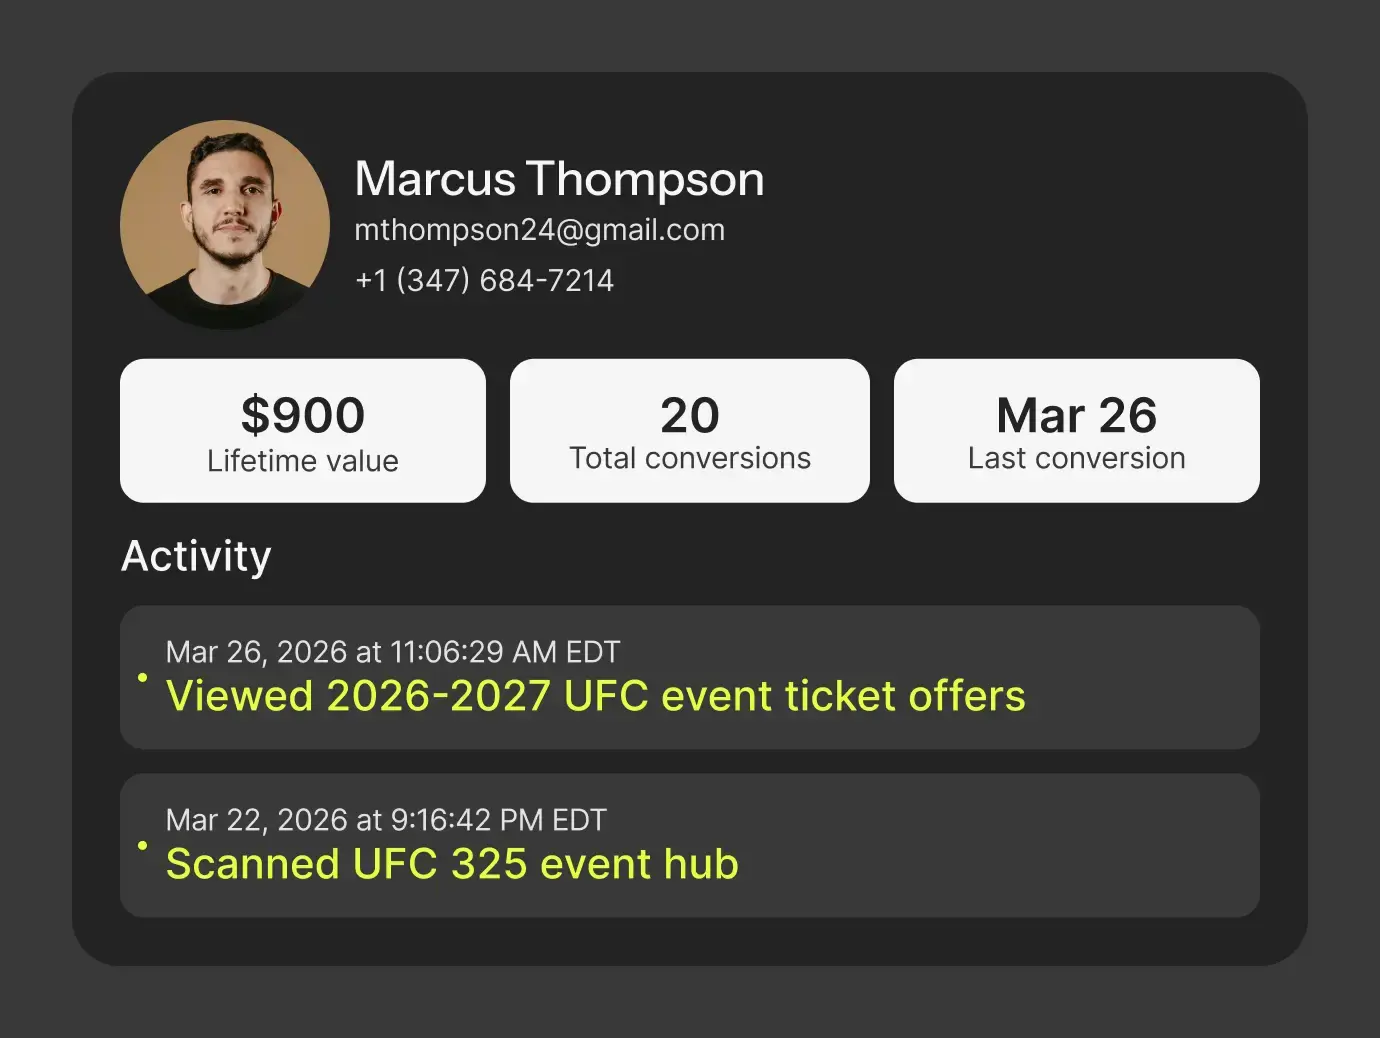
Your Flowcode analytics, Flowlytics, allow you to see how many scans you’ve received on a given date.
To view your Flowlytics, select the ‘View full analytics’ button at the bottom of the ‘Overview’ page.
.jpeg)
Features of the Analytics
- Compare Between Dates: Hover over the graph to see a comparison between a specific date and the previous period. The previous period is determined by the timeframe at which you’re viewing the data (i.e., Last 7 days means a comparison between this week and last, Last 30 days means a comparison between this month and last, etc.). The timeframes being compared will be shown in the key at the bottom right of the graph.
- Diverse Date Ranges: The Flowcode Analytics dashboard will automatically show data for all your Flowcodes over the last 30 days. To change this, use the dropdown in the upper right corner of your dashboard labeled ‘Last 30 days’. You can then choose between Today, Last 7 days, Last 30 days, and Last 90 Days. To see data farther back and within custom date ranges, talk to one of our experts about upgrading to Pro Flex or Enterprise.
- Filtering Options: If you’re interested in looking at the data on a by-code basis, use the ‘Filter’ option in the upper left corner of your dashboard. This will allow you to look at the data for a specific Flowcode, folder, or tag so you can get a more granular analysis.
- Exporting: Continuing in the upper right corner of the Analytics dashboard, there’s an ‘Export’ option. This is great if you want to share data with any internal stakeholders at your company or with clients. You can export into two formats: CSV or PDF. This is a feature available to Pro and Pro+ members. Upgrade now to begin exporting like a data champion!
-
Flowpage Landing Page Analytics
Your Flowpage analytics are very similar to your Flowcode analytics and allow you to see how much engagement you’ve received on a given date. Engagement is broken down into two different categories (specified by the key at the bottom of the graph): Scans and Unique Scans.
Features of the Analytics
- Diverse Date Ranges: similarly to Flowcode, the Flowpage Analytics dashboard will automatically show data for all your Flowpages over the last 30 days. To change this, use the dropdown in the upper right corner of your dashboard labeled ‘Last 30 days’. You’ll be able to filter between Today, Last 7 days, Last 30 days, and Last 90 Days. Access data from farther back and within custom date ranges by talking to one of our experts about Pro Flex or Enterprise.
- Exporting: There’s an ‘Export’ option for your Flowpage analytics. Upgrade to advanced plans to share data with your clients regarding their page performance or let brands know what your engagement rates are for better compensation. Export the data in two formats: CSV or PDF.
- Different Plan Tiers: In addition to basic engagement by date, our different plan tiers offer advanced analytics including a breakdown of your top-performing codes or links and insights on your traffic by device type, day of the week, and time of day.
%2520copy.jpeg)
If you’re interested in accessing more data, such as geolocation or unique vs. recurring scan counts, schedule a call with one of our experts.
Why is QR-code data important?
The only way to understand what is working with your implementation of QR-codes is through data. With Flowcode QR-codes, you have access to all your data within your Analytics dashboard. Utilize this data to understand what is contributing to your engagement, whether good or bad.
Maybe it’s the size of the code within your materials, the channel through which it’s being promoted, or the placement of your assets. Analyzing these will ensure that your codes are receiving their highest engagement and are therefore successful. Without leveraging them, you’re missing the opportunity to understand more about your audience or customers.

How can I use QR-code data to curate my content?
There are few different ways you can analyze your data and use it to your benefit.
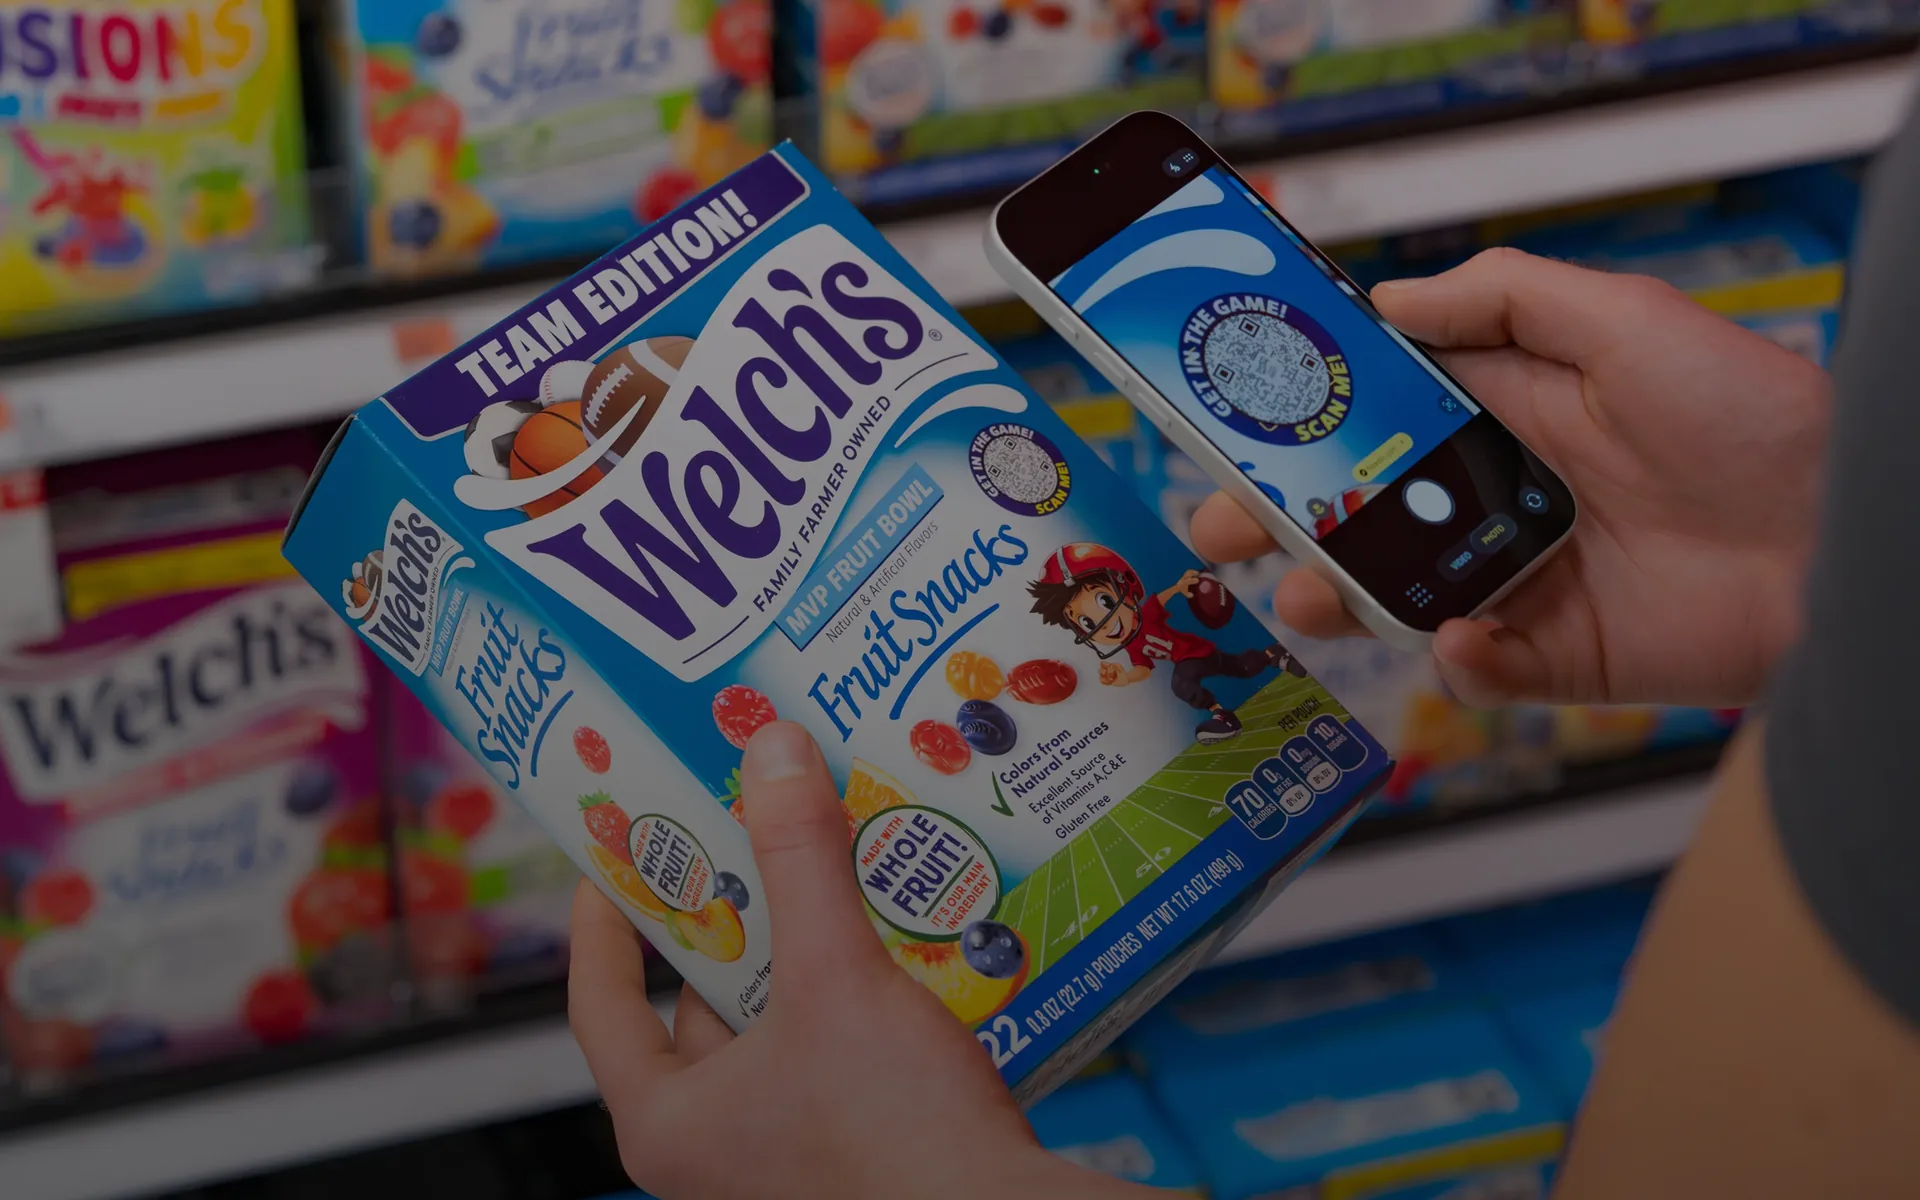
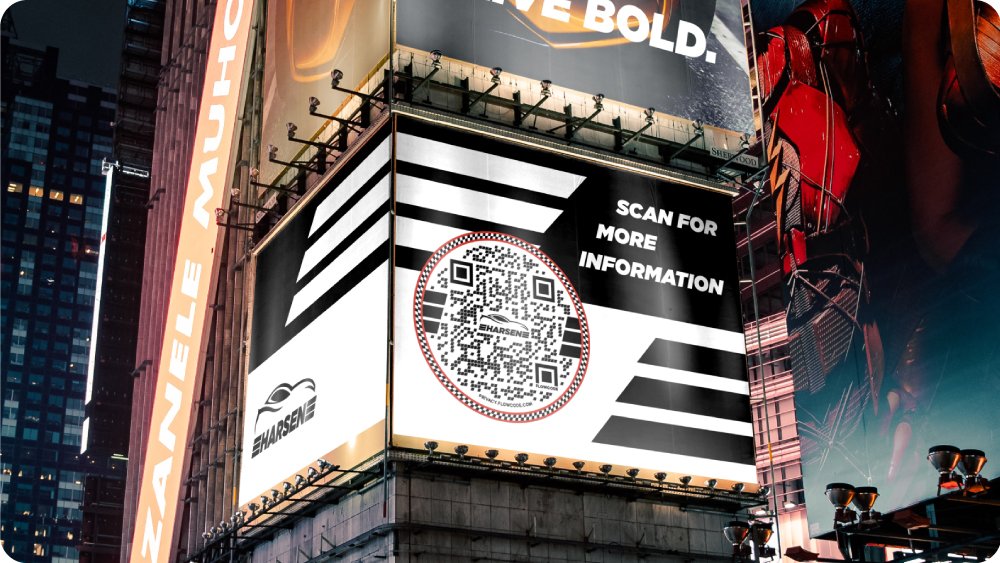
- Create unique codes for each of your marketing materials
- Understand how your audience is interacting with different codes
- See which codes perform the best and which one is performing best.
- Use this analysis to appropriately allocate your marketing budget and cut back on spend for materials that are receiving low engagement.
- Utilizing the Smart Rules capability
For example, a skincare brand saw that most of their customers were scanning their code in the morning and at night. They then used Smart Rules to have the code scan to a morning routine using their products at the beginning of the day and a night routine using their products at the end of the day.
If you’re interested in learning more about Smart Rules, check out more in the Flowcode Onboarding: Creating your first Flowcode post.
What makes Flowcode’s data special?
There are plenty of QR-providers out there, so you may be asking yourself how Flowcode stands out from the crowd. There are three big reasons why Flowcode provides the best analytics:
- Real-time: All data for Flowcode and Flowpage are real-time, meaning you can see the scans roll in by the second. Never miss a scan – refresh your Analytics dashboard to see the most current, up-to-date data.
- First-party: The Flowcode and Flowpage Analytics dashboards give you access to first-party data that other QR-providers don’t. You own it, meaning you can see it whenever you want and can choose who has access to it.
- GDPR & CCPA compliant: Flowcode is General Data Protection Regulation (GDPR) and California Consumer Privacy Act (CCPA) compliant, which means we don’t collect any personally identifiable information at the point of scan – more than other QR-providers can say. Flowcode is a stamp of privacy and security, so your customers can rest assured knowing that you aren’t involuntarily collecting their information.
Last but not least, every single Flowcode comes equipped with unlimited scans. Whether you’re Free or Enterprise, your scan counts will not be capped.
And just like that, you’re done with the Flowcode Onboarding series! We hope that these posts have been helpful and informative, and made you feel like a Flowcode expert ready to take on the world of QR-codes.
If you have any lingering questions, check out our other blog resources or reach out to [email protected].
Congratulations! You've just finished the last section of our Onboarding Series. Do you have more questions? Email [email protected] and we'll get back to you ASAP!
Conclusion