1. Our team will reach out in <30 minutes.
Check your inbox or phone, we’ll tailor your demo to your use case.
2. We build your custom demo
Flowcodes, FlowURLs, and FlowHubs with the data behind the whole platform - so you see exactly what Flowcode unlocks.
3. You go live in days
Our team handles setup. You handle growth.


.png)

.png)
.png)
.png)
.png)


.png)
.png)
.png)

.png)

%20copy%203.png)


How to Track and Analyze Your Flowcode (and Flowpage!): Part II

Flowcode Team
Updated
March 22, 2021

TLDR –
Are you a fan of data? If you’re a marketer, that’s not surprising! And if you’re running Flowcode campaigns, it’s important to understand how people are interacting with your codes.
What time of day is your audience most likely to scan? What devices are they on? These are all parts of your advanced Flowcode analytics — and they can show you how to maximize your Flowcode and get more scans and conversions!
Why Advanced Analytics?
Once you begin digging into your data, you’ll find yourself with more questions than you started with:
- “What’s the best way to convince people to scan?”
- “How many people who scan my code actually take action on the landing page?”
- “What days of the week are most people scanning?”
As we mentioned in Part 1 of this blog, you should set clear Key Performance Indicators (KPIs) so you can measure your results. By themselves, Flowcode metrics don’t say much. But as part of an overall strategy, you can see whether or not you’re placing your codes in the right place with the right call-to-action.
Plus, it’s helpful to see which days of the week have the most scans. Those could be opportunities to run time-limited special-offer campaigns, entice new customers, or recapture previous customers.
For example, let’s say you print a Flowcode on all your product packaging that links to your e-commerce website. If you notice that most of your packaging scans happen on a Friday, you could launch a Friday flash sale that rewards customers for scanning on that day.
Advanced Analytics
The basic Flowcode dashboard will show you the basic counts of how many scans your code got for:
- the current day
- the current week
- the current month
- the current year
- all time
This is a great place to start, but to truly assess how your Flowcode is performing, you can upgrade to Flowcode Pro . With Pro, you can see how your customers or audience are interacting with your codes and Flowpages — and how the date and time of each scan correlates with actions on the Flowpage.
Bringing Flowcode and Flowpage together
If your Flowcode leads to your Flowpage, then you can get some really juicy data on your Advanced Analytics dashboard. After all, there’s little point in someone scanning your Flowcode if no one takes action, right? By upgrading to Flowcode Pro, you can see exactly how effectively your Flowcode leads to results.
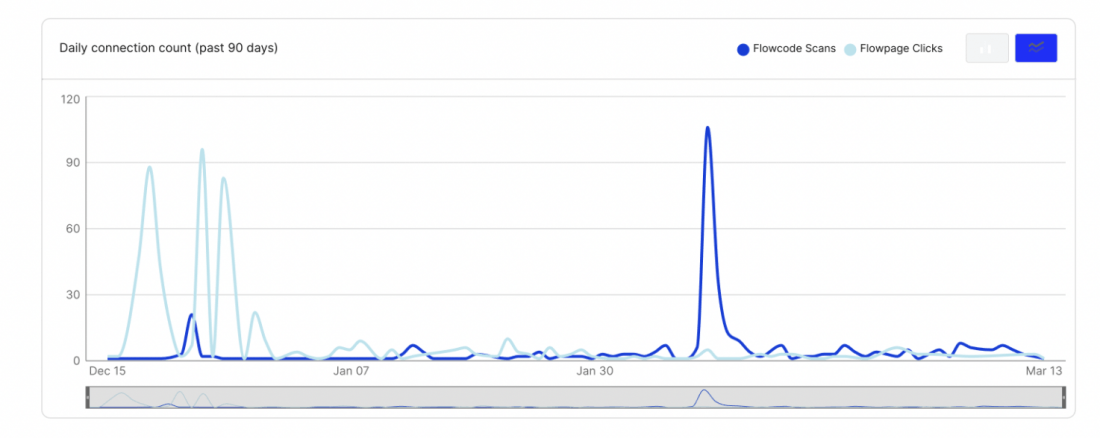
Daily Connection Count: This is how many people scanned your code and, if applicable, clicked on a link in the connected Flowpage. You can easily see which days have the best conversions for both scans and clicks, which can help you optimize your Flowcode campaigns.
Connections by Day of Week: Get detailed insights into how many scan your Flowcode each day of the week, as compared to how many people click on your Flowpage. The numbers might not line up. For example, a lot of people may scan your code on Monday but take no action, while only a few people scan it on Friday but most click a link on the landing page. These insights can help you craft more effective campaigns.
Connections by Time of Day: Are people seeing your code in the morning, evening, or some time in-between? The answer can help you figure out which offers to promote and how to construct your campaigns. For example, if you’re pushing a breakfast special through a Flowcode but most people scan it in the evening, you probably want to reconsider the call-to-action.
Understanding how your Flowcode and Flowpage interact is crucial to your offline to online marketing success. You should also pay close attention to when people interact with your codes and landing pages: different times of day have different impacts! When you upgrade to Flowcode Pro, you’ll gain access to advanced analytics that give you ultra-valuable insights.