1. Our team will reach out in <30 minutes.
Check your inbox or phone, we’ll tailor your demo to your use case.
2. We build your custom demo
Flowcodes, FlowURLs, and FlowHubs with the data behind the whole platform - so you see exactly what Flowcode unlocks.
3. You go live in days
Our team handles setup. You handle growth.


.png)
.png)
.png)
.png)
.png)
.png)
.png)
.png)
.png)
%20copy%203.png)

How the Flowcode Suite Powers Faster Insights

Kayla Uytengsu
Growth Marketing
Updated
December 21, 2022
TLDR –
Flowcode is more than just a QR code company. We're a unified end-to-end platform that enables you to bring customers from offline experiences to digital conversion, gathering data insights throughout the process.
Flowcode is an offline-to-online suite that helps you understand consumer behavior, identify audience opportunities, and improve your marketing strategies painlessly. This is all powered by data. Flowcode Analytics or "Flowlytics" is the backbone of our products. This data hub combines all your customer and campaign information in one easy-to-use platform.
What does this mean for you? When you activate your business with Flowcode, you unlock unparalleled insights on your OOH marketing materials. Here, you can access impressions, CTRs, conversion rates, geographic hotspots, and even identify your return on ad spending.
All this data is migrated in real-time with precision – meaning you can gather scan data from the exact time and location, updated to your interactive dashboard in seconds.
How does the Flowcode product suite work?
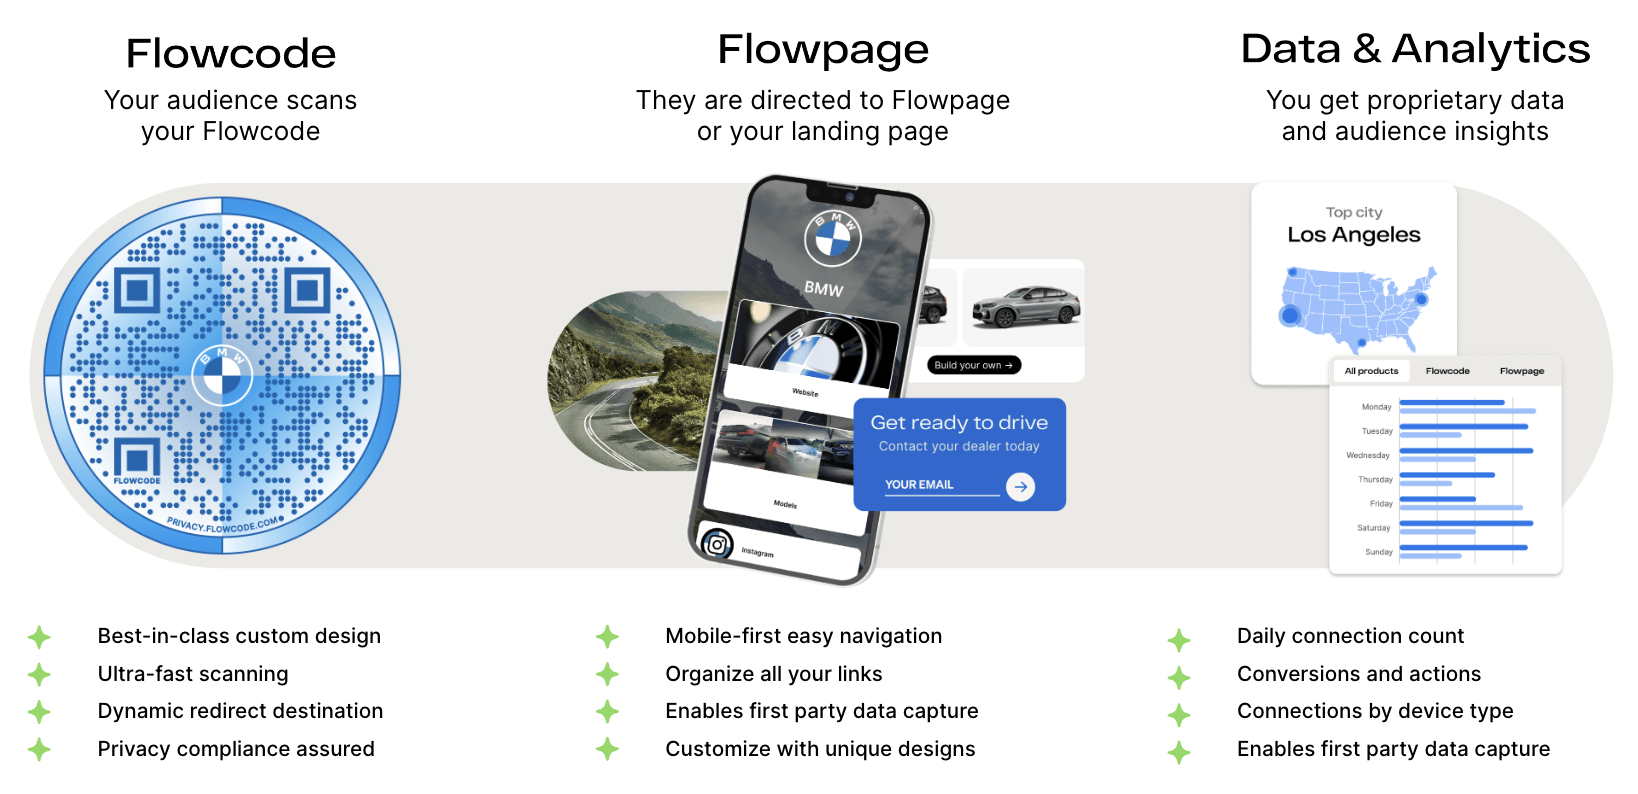
To get the most out of your offline marketing, use the entire Flowcode product suite in tandem to craft a seamless customer experience and capture the most data possible. Here's how:
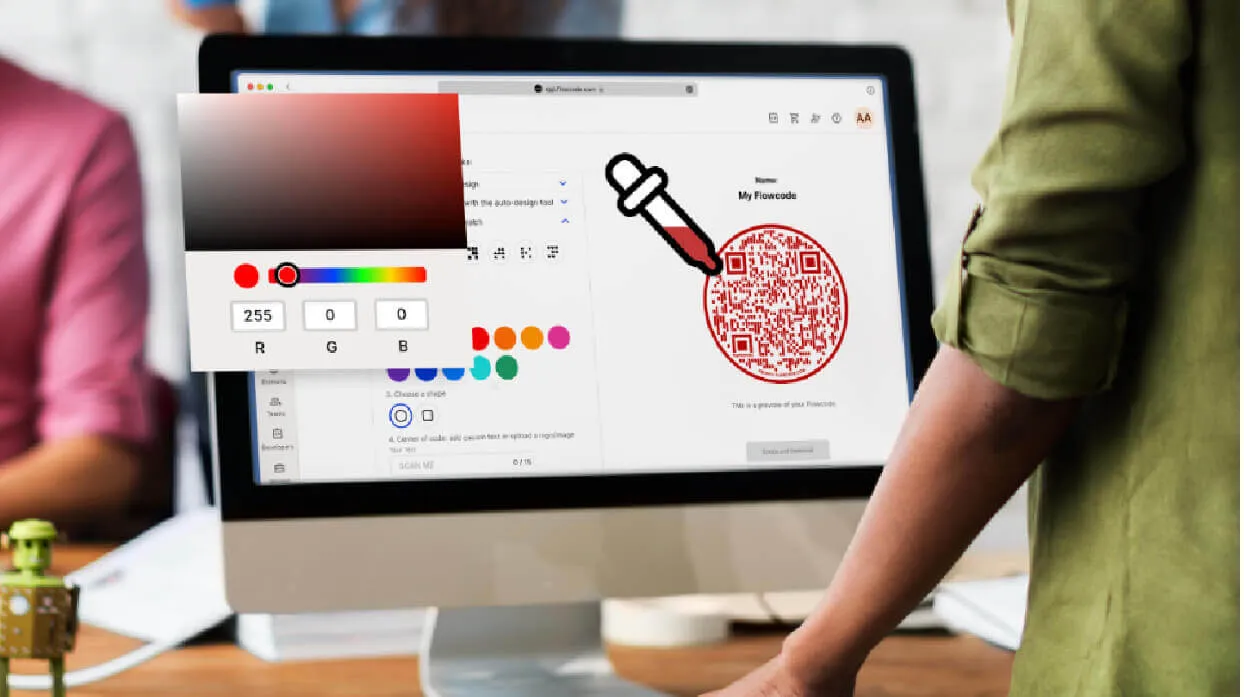
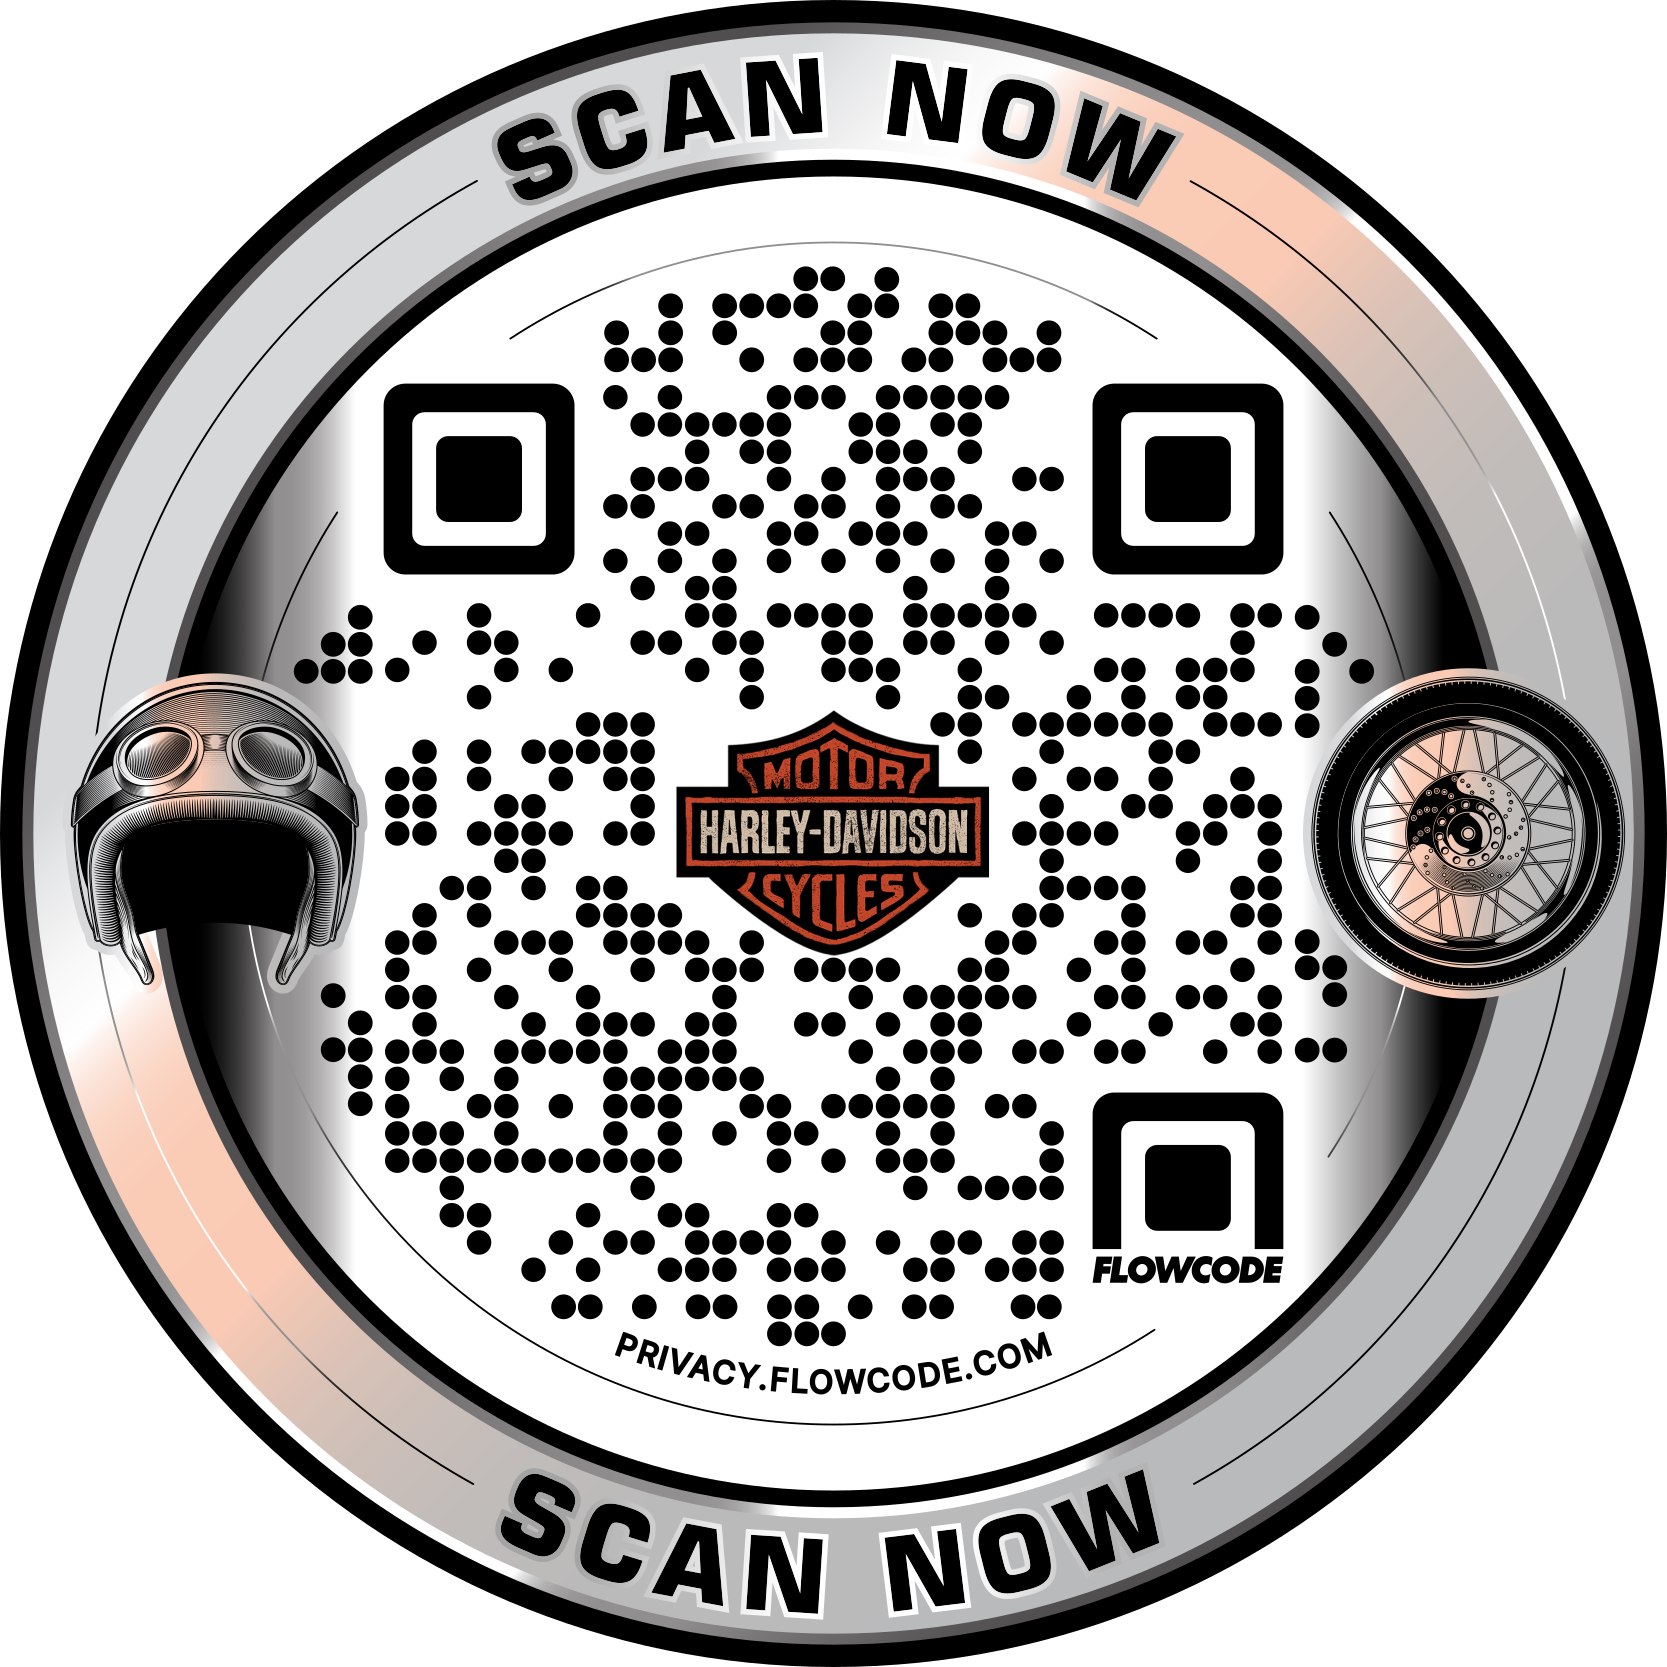
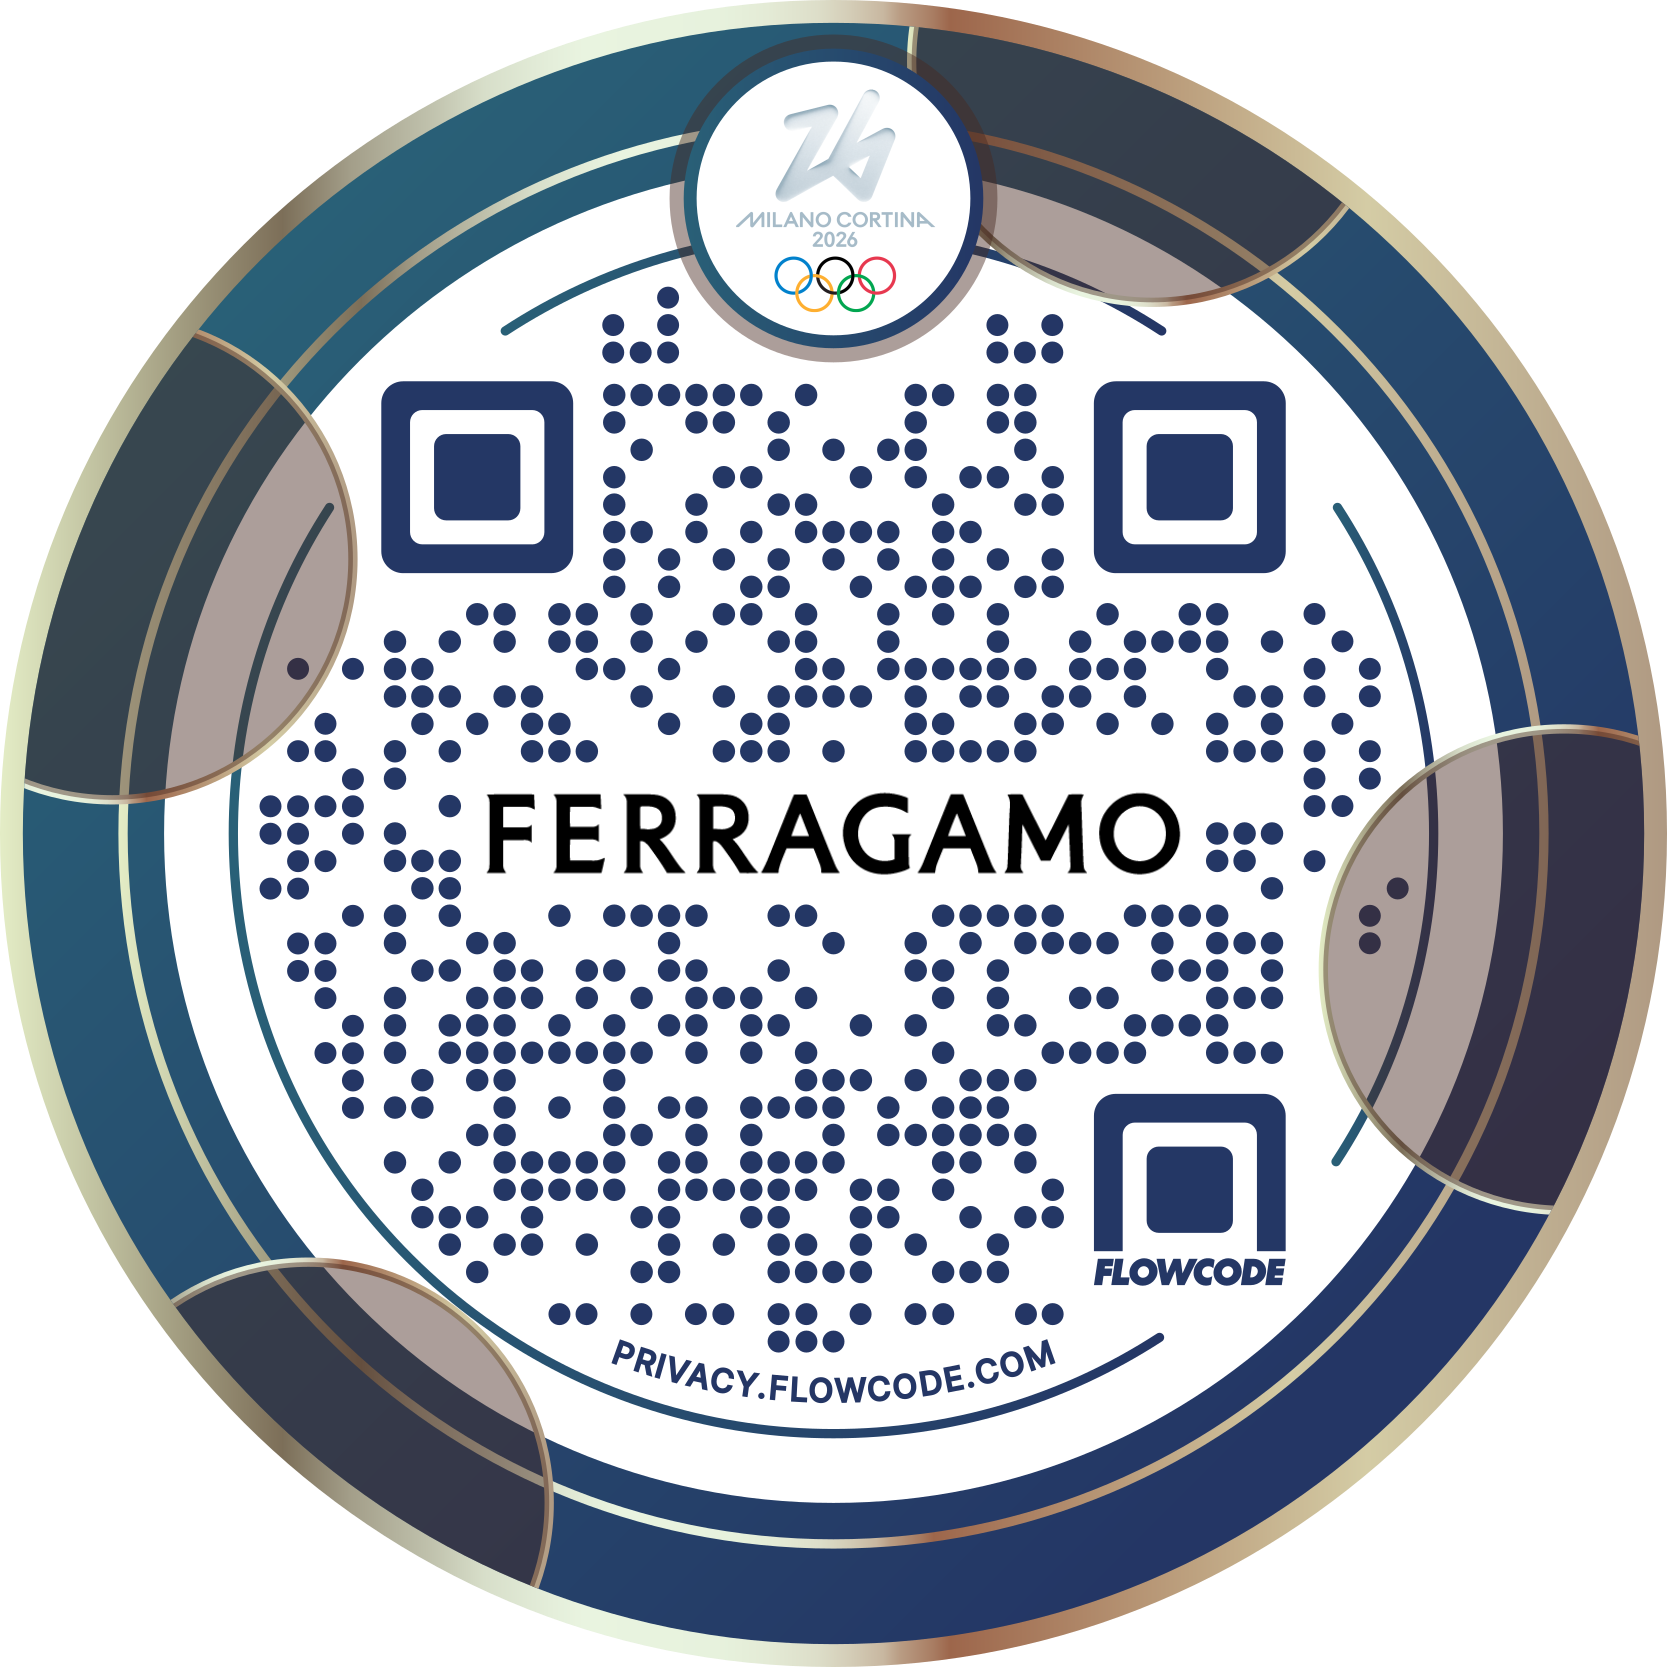
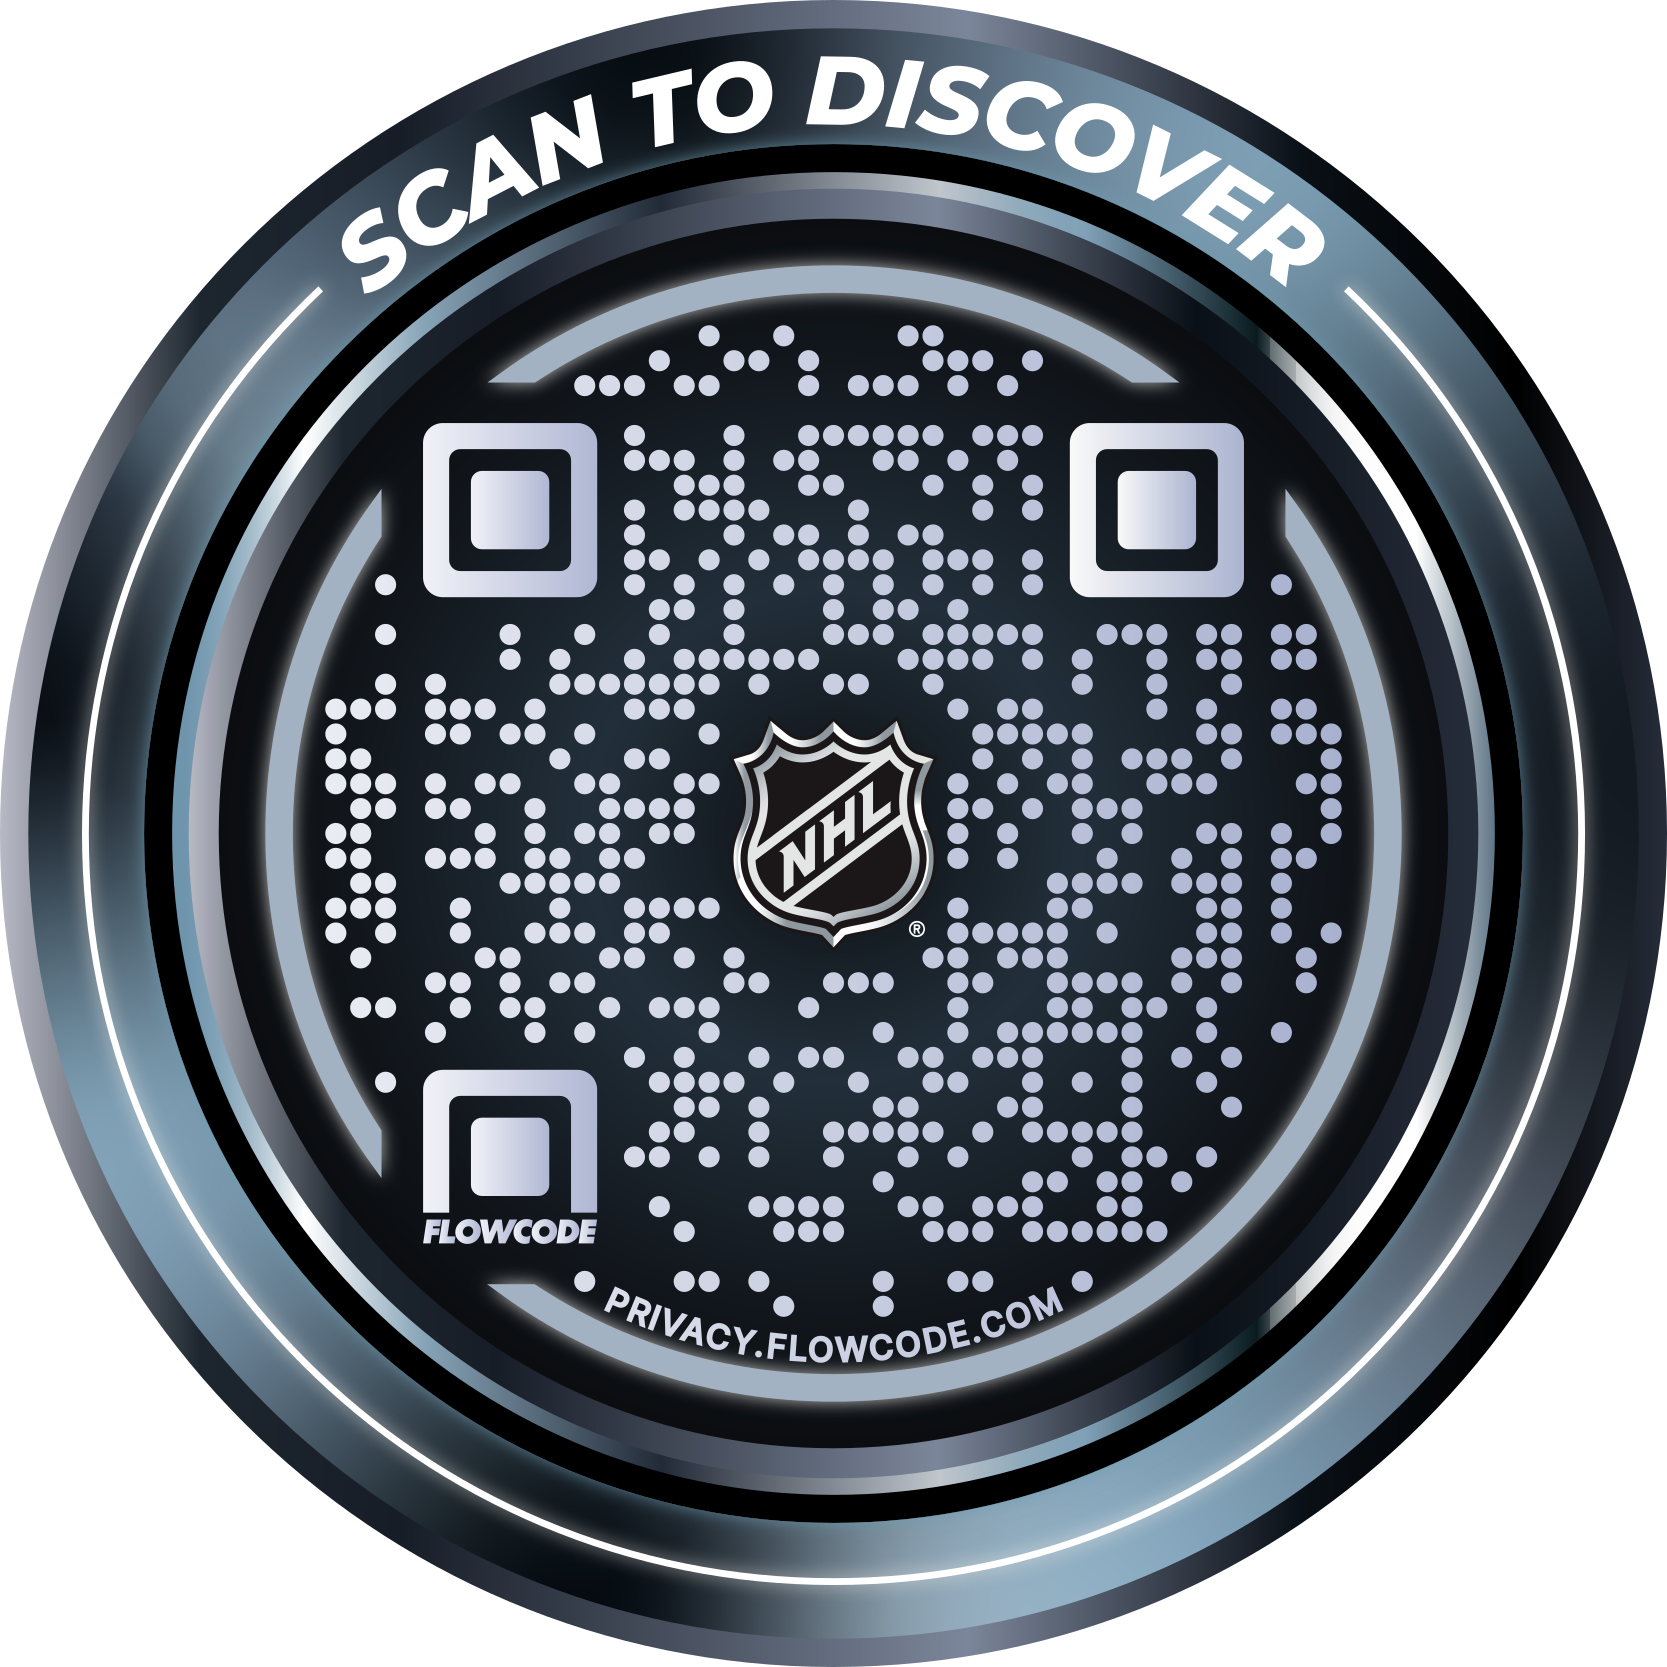
1. Create a Flowcode: Create a customizable QR code that matches your brand aesthetic. Add this to your physical marketing collateral, or create completely new collateral with Flowcode's template studio and print store. Activate your codes and get them into the world -- online, in print, or on TV.
2. Launch a Flowpage: Connect your Flowcode to a unique Flowpage scan destination. Curate your very own campaign landing page with our widgets and highlight your top CTA's to create a high-conversion customer journey.
3. Analyze with Flowlytics: Use the Flowcode analytics portal to discover all engagement metrics across your Flowcodes and Flowpages. Here, you can understand exactly how and when customers are engaging with your brand and gain insight into your primary audience. Use this tool to filter and compare, run tests, and track engagement over time to get the most out of your OOH marketing.
How is Flowcode Analytics faster?
1. Real-time 1st party data:
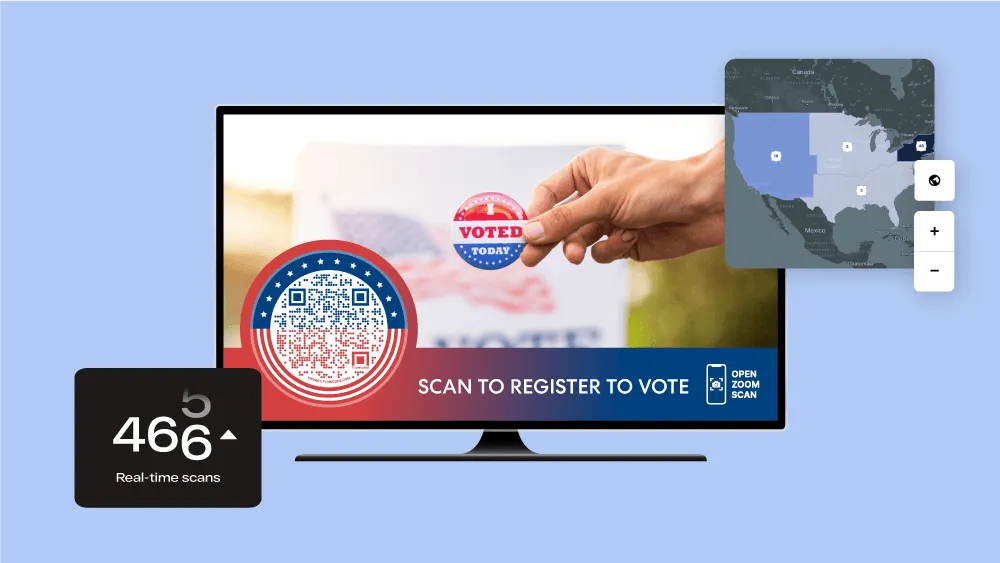
- All data for Flowcode and Flowpage are real-time, meaning you can see the scans roll in by the second. Never miss a scan – refresh your Analytics dashboard to see the most current, up-to-date data.
- The Flowcode and Flowpage Analytics dashboards give you access to first-party data that other QR-providers don’t. You own it, meaning you can see it whenever you want and can choose who has access to it.
2. Clear dashboard visualization:
- Flowcode Analytics is intuitive to use. The platform allows you to view macro data, combining all scan activity in one place or filter between specific QR codes or pages to monitor precise activity or compare them head to head.
- Advanced platform features allow you to identify top performing clicks, geo-locate users on an interactive heat map, and even track a customer's journey with UTMs and pixels.
3. Easy to share:
- It's easier than ever to share your analytics with your team through our features. Data is downloadable as a PDF report, available for CSV export, use Flowcode analytics reports emails, and integrate with S3, STFP, and Webooks.
- Use our Teams features to collaborate with members of your organization and allow them to engage in custom filtering, analyze dashboard charts, and more.
What kind of data does Flowcode Analytics capture?
Flowlytics captures data for both your Flowcodes and Flowpages. You can view this data by scan data by day, week, month, and the last 90 days. For more information, learn how to navigate our dashboard.
With advanced and paid features, you can gather even more in-depth data such as:
- Interactions by date, day of week, and even the time of day
- Top performing links
- UTM source tracking
- Referrals tracking
- Custom pixel retargetting
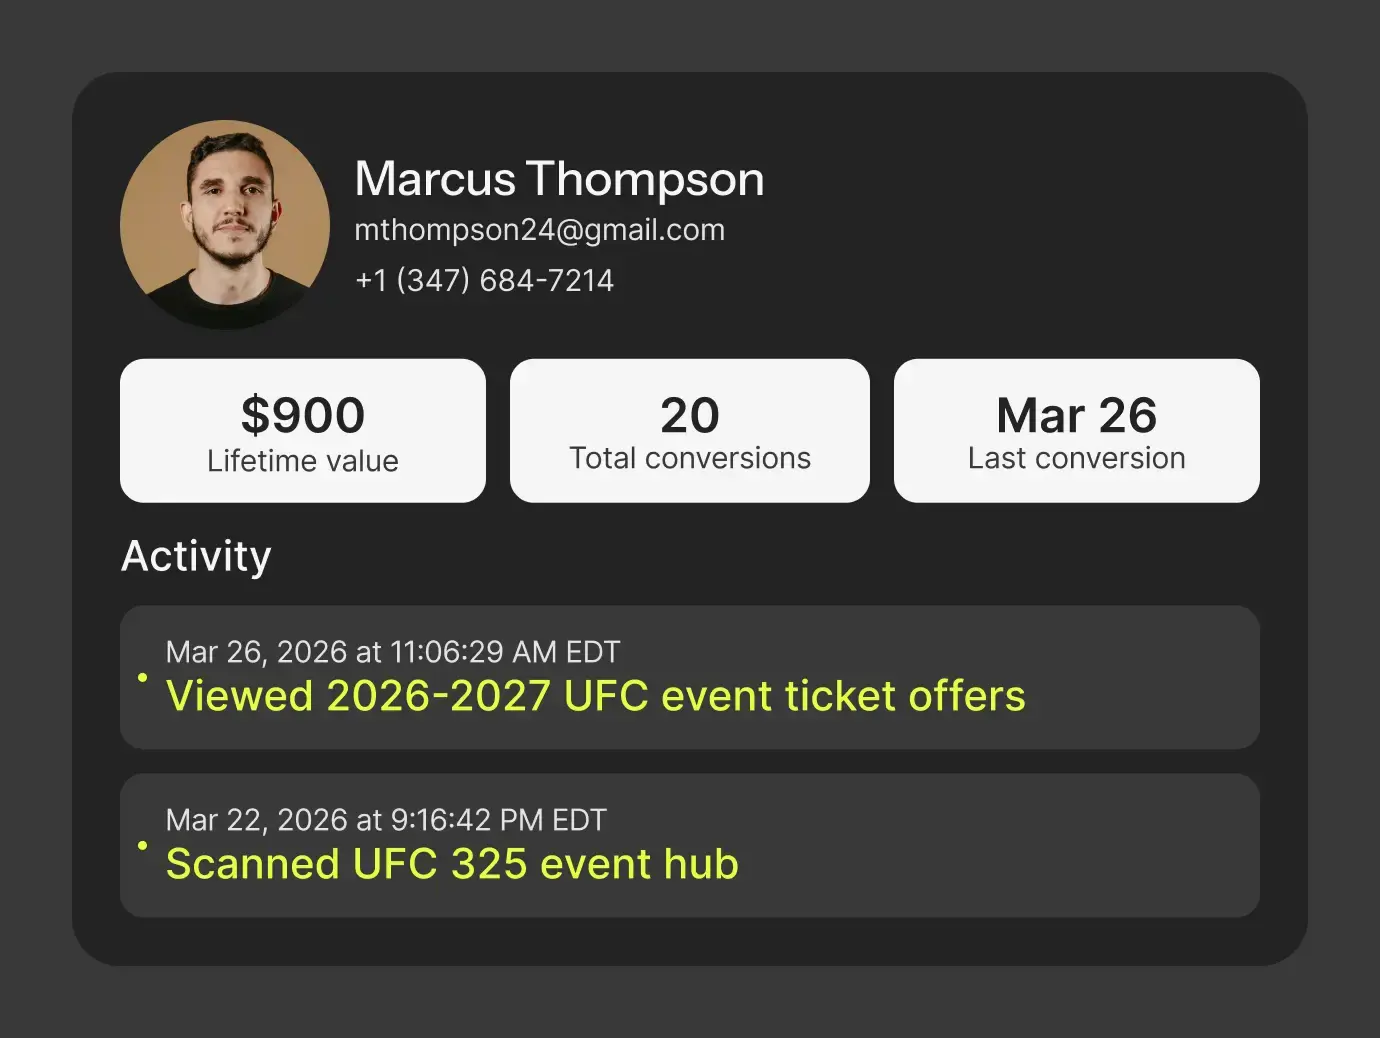
By integrating your O2O campaign with both Flowcode and Flowpage, you unlock even more insight into a customer's journey and can track their process from acquisition to conversion.
How can I get the most out of Flowcode analytics?
Get the most out of Flowlytics when you upgrade to our paid plans. Get basic scan and click reporting free, but unlock more with our Pro and Pro+ plans that enable you to more easily:
- Run tests
- Launch an A/B testing design, CTA messaging, or placement of your physical marketing collateral
- Run a customer segment test by using unique messaging for audiences across demographics and geographies; use bulk code generation to get household level data
- Use conversion pixels on a customized landing page to analyze which calls to action are most effective in driving your customer to purchase
- Generate reports and integrations
- Download your report as a PDF or export as a CSV
- Integrate with S3, STFP, and Webooks
- Schedule custom analytics email reports from the Flowcode team
- Use teams
- Collaborate directly with your team by adding seats on Flowteams
- Enable all members to access and share data easily when you make your dashboard interactive for everyone
Flowcode Analytics makes it easy to understand how your Flowcodes and Flowpages are performing in the real world with your customers, and provides feedback instantly.
Simply use the Flowlytics page to explore the performance of your different codes and pages, filter searches to suit your needs, track specific campaigns with geo-location and UTMs, and export data in a simple dashboard to communicate performance with your team!
.webp)